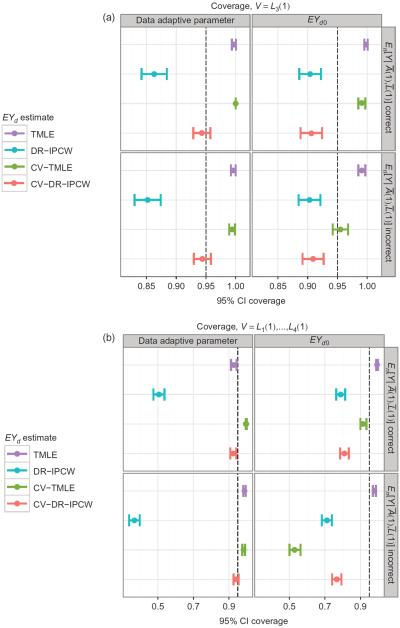
Figure 2.
Coverage of 95% confidence intervals from the TMLE and DR-IPCW methods with respect to both EP0 Yd0 and the data adaptive parameter ψ0n for the TMLE and DR-IPCW and for the cross-validated methods. Results are provided both for the cases where the estimate of is correctly specified and the case where this estimate is incorrectly specified with the constant function 1/2. The (CV-)TMLE outperforms the (CV-)DR-IPCW estimating equation approach for almost all settings. Error bars indicate 95% confidence intervals to account for uncertainty from the finite number of Monte Carlo draws in our simulation. (a) V=L1(1), (b) V=L1(1), …, L4(1).

