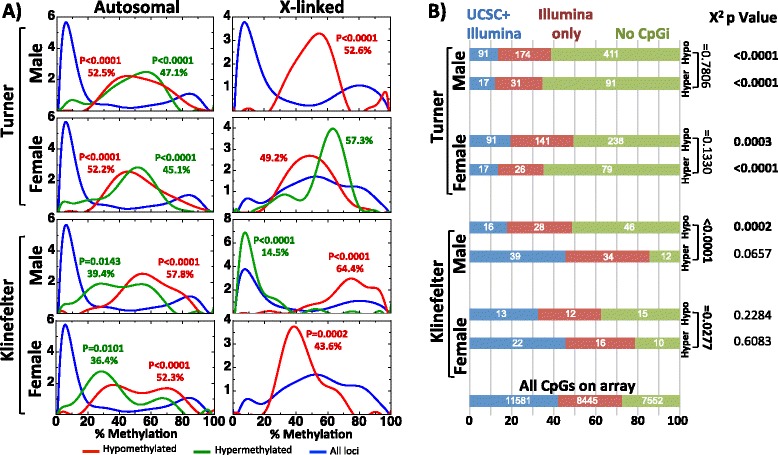
Fig. 3.

Characteristics of the differentially methylated CpGs. a The level of methylation of differentially methylated regions (red and green curves represent the normal methylation frequency of the hypomethylated and the hypermethylated CpG sites, respectively) in comparison to their methylation levels in male and female samples (blue curves represent the frequency of methylation distribution of all analyzed CpG sites). The p values of the Chi-square test for trend between the methylation frequency distribution of either the hypo- or hypermethylated loci in comparison to all CpG sites on the array are also shown (when significant), together with the average methylation. The autosomal (left column) and X-linked loci (right column) were analyzed separately. b CpG island status: the differentially methylated regions were investigated for their CpG island status and were divided into three groups, blue if the CpG occurs in a CpG island based on both the Illumina array annotation and the UCSC, red if the CpG occurs in a CpG island based on only Illumina array annotation, and green if the CpG occurs in no CpG island. Next, this data of each comparison is compared to the distribution of all CpGs in the array, and Chi-square p values are shown at the right. Also, p values of the comparison between the hypo- and hyper-locations are shown
