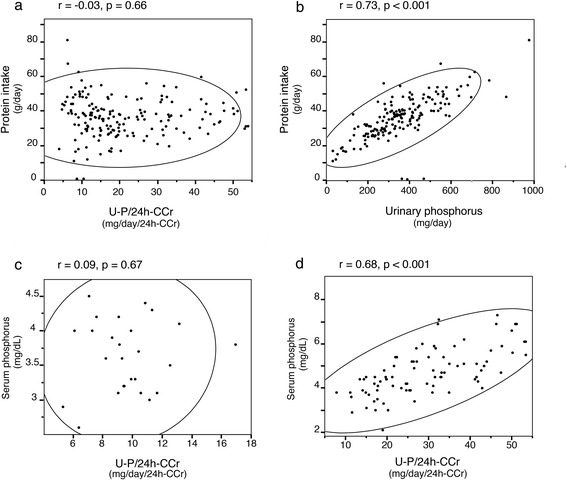
Fig. 2.

Bivariate fit plot. a Bivariate fit plot of protein intake by 24-h urinary phosphorus per creatinine clearance. b Bivariate fit plot of protein intake by urinary phosphorus. c Bivariate fit plot of serum phosphorus by urinary phosphorus per 24-h creatinine clearance (24-h U-P/CCr) in patients with CKD stage G3b. d Patients with CKD stage G5. r denotes Pearson’s correlation coefficient, p denotes p values for correlation, and the ellipsoidal line indicates Bivariate Normal Ellipse where p = 0.95
