Figure 3.
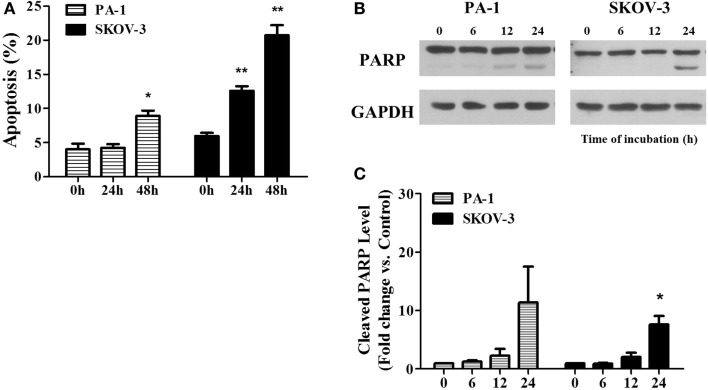
PEITC induces apoptosis in ovarian cancer cells. PA-1 and SKOV-3 were incubated with vehicle or 5 μM of PEITC for 24 or 48 h. Apoptotic cell death was measured by Annexin V & PI straining using flow cytometry. Bar graph represents the mean percentage of apoptosis (A). PARP cleavage was detected in PA-1 and SKOV-3 cells after time dependent of PEITC treatment by western blotting (B). Cleaved PARP bands were determined by densitometry of bands using ImageJ software and, statistical analysis was performed by SPSS 20.0 software (C). Values are means ± SEM (*P < 0.05, **P < 0.01 vs. the vehicle control).

