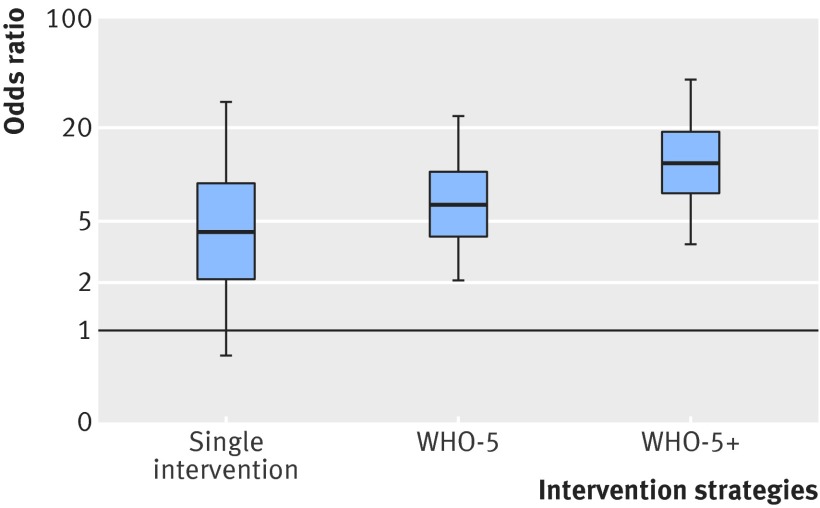
Fig 7 Box-and-whiskers plot showing relative efficacy of different hand hygiene intervention strategies compared with standard of care estimated by network meta-analysis from interrupted time series studies. Lower and upper edges represent 25th and 75th centiles from posterior distribution; central line median. Whiskers extend to 5th and 95th centiles. Intervention strategies were single intervention; WHO-5; and WHO-5+ (WHO-5 with incentives, goal-setting, or accountability). Appendix 9 shows results from sensitivity analysis that excluded studies where interventions were implemented as multiple time points

An official website of the United States government
Here's how you know
Official websites use .gov
A
.gov website belongs to an official
government organization in the United States.
Secure .gov websites use HTTPS
A lock (
) or https:// means you've safely
connected to the .gov website. Share sensitive
information only on official, secure websites.
