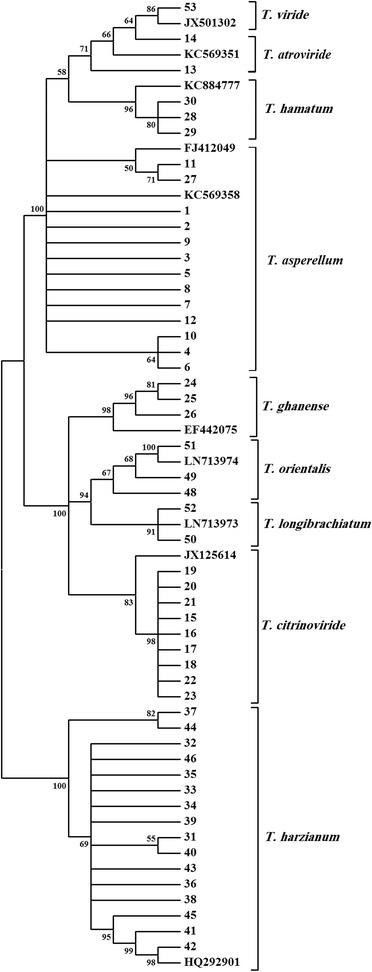
Fig. 1.

Phylogram representing the relationship of 52 Trichoderma isolates to sequences of 9 reference isolates. The analysis is based on the ITS rDNA sequences inferred by a neighbor-joining method search. Numbers within the tree represent the bootstrap values (values above 50 % are indicated; 1000 replications)
