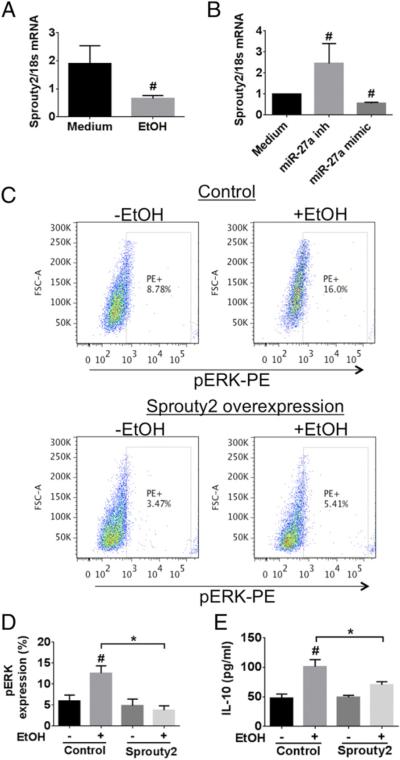
FIGURE 6.
Sprouty2 levels are modulated by miR-27a in the monocytes treated with ethanol. (A) Monocytes were treated with 25 mM EtOH for 24 h and the mRNA level of sprouty2 was determined. (B) Monocytes transfected with or without miR-27a inhibitor or miR-27a mimic were evaluated for the mRNA levels of sprouty2. (C) Sprouty2 overexpressing monocytes were stimulated with 25 mM EtOH for 24 h. We determined the levels of p-ERK by flow cytometry. Representative dot plots for each treatment condition are shown. The percentages of PE+ cells are the cells expressing activated p-ERK. (D and E) Healthy monocytes were transfected with sprouty2 overexpression construct and were stimulated with 25 mM EtOH for 24 h. (D) Levels of p-ERK were determined by flow cytometry. (E) Levels of IL-10 cytokine were determined in the culture supernatant by ELISA. The data are represented as means ± SEM of three independent experiments. *p < 0.05. #p < 0.05 compared with medium or control. EtOH, ethanol.

