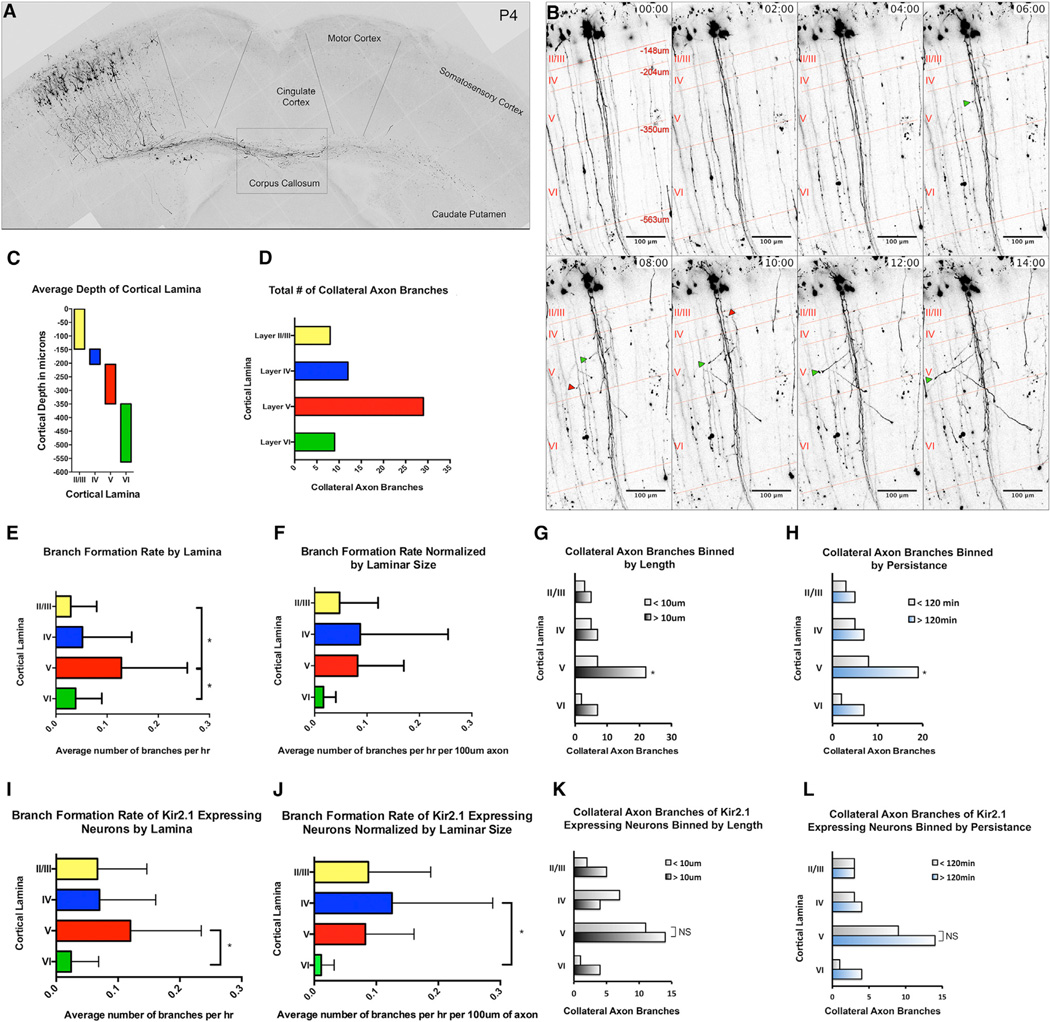
Figure 2. Real-Time Analysis of Collateral Axon Branch Formation by Layer II/III Pyramidal Neurons in S1.
(A) A single image from a time-lapse imaging session obtained from an organotypic brain slice (see also Movie S1).
(B) Representative time-lapse images of layer II/III pyramidal neurons between P2.5 and 3.5 (see also Movie S2). Red lines and cortical layer labels demarcate average depth of cortical layers. At P3, layer II/III spans a depth of −148 µm, layer IV spans a depth between −148 µm and −204 µm, layer V spans a depth between −204 µm and −350 µm, and layer VI spans a depth between −350 µm and −562 µm. We found both short, transient, collateral axon branches (red arrows) and longer, more-stable, collateral axon branches (green arrows) emerging from primary axons.
(C) Graphical representation of average cortical depth by lamina.
(D) Total number of collateral axon branches formed in each lamina during our imaging sessions.
(E and F) The average branch formation rate was determined within each lamina in its entirety (E) and for each lamina by unit length of axon (F). To assess any difference in collateral axon branches formed in each lamina, a categorical analysis of axon branches was performed.
(G and H) Collateral axons were grouped by layer and length (G) and by persistence (H). Spontaneous activity contributions to the formation of collateral axon branches were determined with an analysis of time-lapse images of Kir2.1-expressing neurons.
(I and J) The average rate of branch formation was determined within each lamina in its entirety (I) and for each lamina by unit length of axon (J) of Kir2.1-expressing neurons.
(K and L) A categorical analysis of the axon branches formed was performed, and collateral axon branches of Kir2.1-expressing neurons were grouped by layer by length (K) and persistence (L).
Branch formation rates were assessed by ANOVA followed by a Tukey’s test (E, F, I, and J), and collateral axon branch length and persistence were analyzed using a Cochran’s Q test (G, H, K, and L). * indicates a p value < 0.05. Error bars denote SD. See also Movies S1, S2, and S3.

