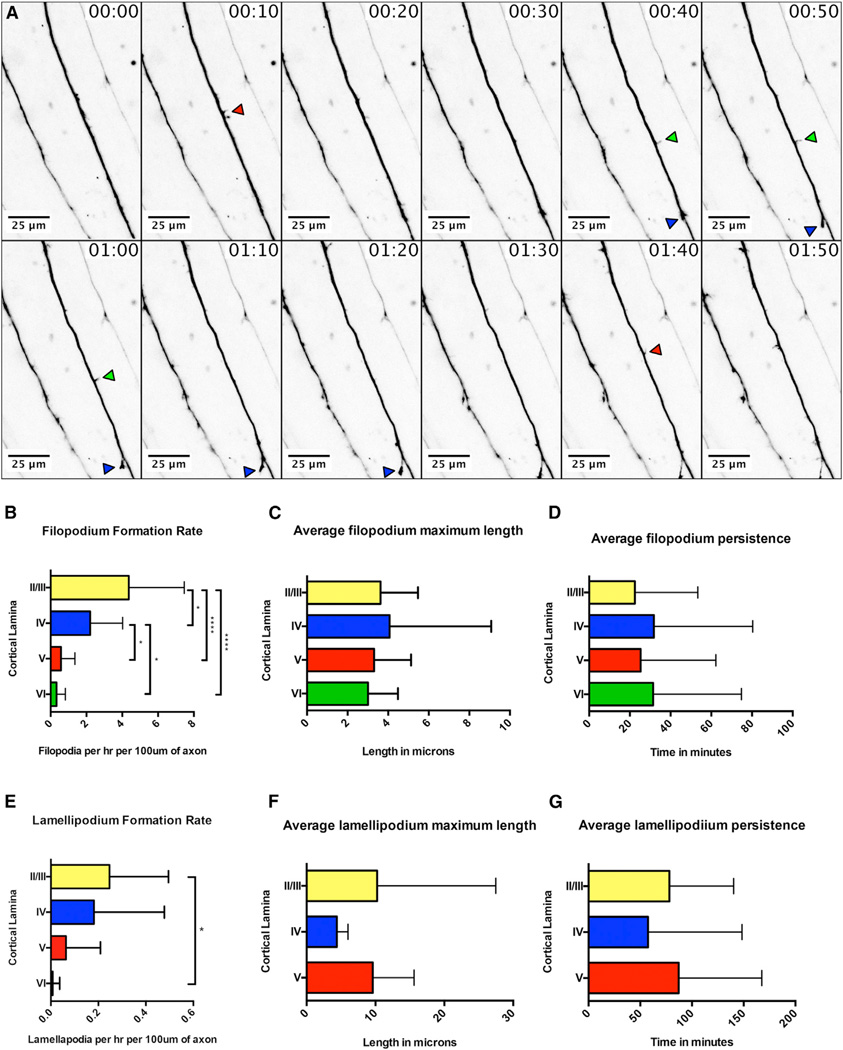
Figure 3. Real-Time Analysis of Filopodial and Lamellipodial Dynamics during Collateral Axon Branch Formation by Layer II/III Pyramidal Neurons in Ipsilateral S1.
(A) Representative images from a time-lapse analysis of filopodial dynamics along primary axons from layer II/III pyramidal neurons within ipsilateral S1 (see also Movie S4). Red arrows denote transient filopodia, green arrows more-persistent filopodia, and blue arrows the successful formation of a collateral branch.
(B–D) Time-lapse images were acquired in all cortical layers, and axons were assessed for filopodium formation (B), filopodium length (C), and filopodium persistence (D). Filopodia were generated in all cortical layers, with the highest rate of formation occurring in the most superficial layers (B). No significant difference was found in the average maximum length of filopodia across cortical layers (C) or in the average persistence of filopodia across cortical layers (D).
(E–G) Similar to filopodia, we found that lamellipodia were generated in all cortical layers, with the highest formation rate occurring in the most superficial layers (E). We did not observe a significant difference in the average maximum length or average persistence of lamellipodia across cortical layers (F and G, respectively).
* indicates a p value < 0.05, and **** indicates a p value < 0.0001. Error bars denote SD. See also Movie S4.

