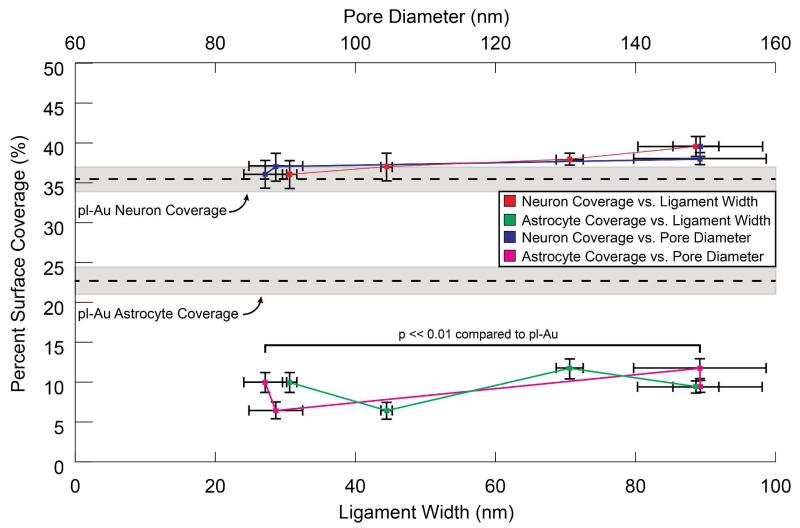
Figure 8.
Quantification of neuron and astrocyte coverage vs. ligament width and pore diameter on the different np-Au surface morphologies shows a similar value for neuron coverage when compared to planar gold and a sustained decrease in astrocyte coverage on each morphology tested. The dashed horizontal lines and the shaded regions indicate mean cell coverage and its standard deviation on pl-Au respectively.

