
FIGURE 3.
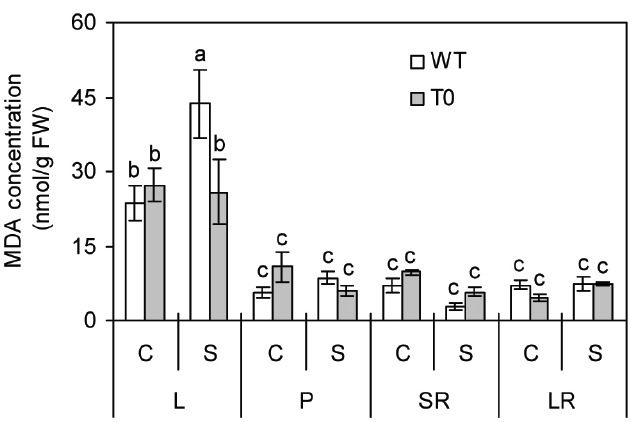
Malondialdehyde (MDA) concentration in leaf (L), petiole (P), storage root (SR), and lateral root (LR) of 2-month-old wild-type (WT) and chimeric plants (T0) co-expressing ZxNHX and ZxVP1-1 grown under control (C) and salinity (S) condition (treated with 400 mM NaCl for 8 days). Data are mean ± SE (n = 6) and bars indicate the SE. For T0 chimeric plants, values are derived from a combination of single plants each from one of six lines. Columns with different letters indicate significant difference at P < 0.05 (Duncan’s test).