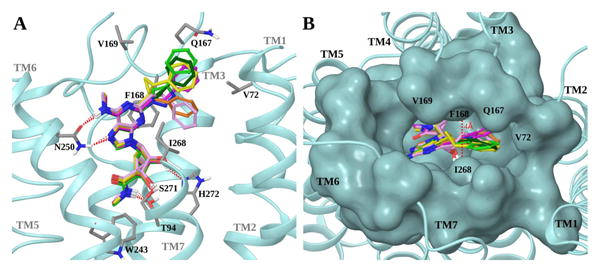
Figure 1.

Superposition of the docking poses of trial compounds 3a – f (R = CH3, Ar = Ph) in the hA3AR hybrid homology model. A. Side view of the receptor (shown in cyan ribbon). Ligands are shown in sticks with different carbon colors (3a, dark green; 3b, orange; 3c, pink; 3d, yellow; 3e, magenta; 3f, light green). Side chains of residues important for ligand recognition are shown in sticks (grey carbons), and H-bonding interactions are indicated by red dashed lines. Non-polar hydrogen atoms are not displayed. The view of TM7 is partially omitted. B. Top view of the receptor showing the surface of the binding site residues in cyan. Ligands are shown in sticks with different carbon colors (color scheme as in panel A). The distance between Phe168 (EL2) and Ile268 (7.39) is highlighted.
