
Table 2.
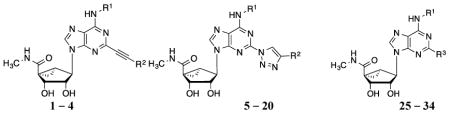
Structures and binding affinitiesa of AR agonists, including reference compounds 1-4, triazole derivatives 5-20 and their synthetic intermediates 25-34.
| |||||
|---|---|---|---|---|---|
| Compd. | R1 | R2 or R3 | A1AR% inhibition or Ki (nM)a | A2AAR% inhibitionc | A3AR% inhibition or Ki (nM)a |
| 1b,d |
|
|
6 ± 4% | 41 ± 10% | 3.49±1.84,3.08±0.23 (m) |
| 2b,d | CH3 |
|
6 ± 1%, | 24 ± 13%, | 0.70 ± 0.11,36.1±4.7 (m) |
| 4b,d | CH3 |
|
25 ± 2% | 47 ± 2% | 2.68 ± 0.44 |
| 5d | CH3 |
|
18 ± 4% | 35 ± 8% | 0.96 ± 0.07 |
| 6 | CH3 |
|
20 ± 5% | 31 ± 6% | 0.95 ± 0.50 |
| 7 | CH3 |
|
9 ± 4% | 39 ± 4% | 1.06 ± 0.10 |
| 8 | CH3 |
|
29 ± 7% | 26 ± 2% | 1.84 ± 0.38 |
| 9 | CH3 |
|
14 ± 7% | 27 ± 3% | 3.48 ± 0.97,334 ± 49 (m) |
| 10 | CH3 |
|
25 ± 10% | 8 ± 3% | 2.21 ± 0.34 |
| 11 | CH3 |
|
2 ± 2% | 1 ± 1% | 2.16 ± 0.32 |
| 12 | CH3 |
|
43 ± 2% | 51 ± 1% | 0.96 ± 0.09 |
| 13 | CH3 |
|
12 ± 7% | 40 ± 6% | 1.25 ± 0.27 |
| 14 | CH3 |

|
27 ± 8% | 34 ± 5% | 0.73 ± 0.10 |
| 15d | C2H5 |
|
15 ± 11% | 32 ± 5% | 1.22 ± 0.26,9.64 ± 0.84 (m) |
| 16 |
|

|
77% | ND | 7.05 ± 5.81,14.2 ± 0.2 (m) |
| 17 |
|
|
65% | ND | 9.02 ± 5.78,6.53 ± 0.58 (m) |
| 18 |
|
|
58% | ND | 6.66 ± 2.07 |
| 19 | CH3 |
|
33 ± 7% | 7 ± 6% | 0.58 ± 0.17 |
| 20 | CH3 |
|
23 ± 3% | 54 ± 2% | 3.09 ± 0.21 |
| 25b | CH3 | I | ND | ND | 1.91 ± 0.85 |
| 26 | CH2CH3 | I | 1910 ± 300 | 11 ± 7% | 1.22 ± 0.21 |
| 27 |
|
I | 93% | >10,000 | 1.53 ± 0.45 |
| 28b |
|
I | 2200e | >10,000 | 3.6 |
| 29 |
|
I | 68% | 42% | 0.91 ± 0.14 |
| 30 | CH3 | N3 | 77 ± 1% | 1 ± 1% | 0.54 ± 0.10 |
| 31 | CH2CH3 | N3 | 707 ± 152 | 11 ± 6% | 0.69 ± 0.08 |
| 32 |
|
N3 | 100% | 46% | 0.85 ± 0.10 |
| 33 |

|
N3 | ND | 2770e | 1.08 ± 0.75 |
| 34 |
|
N3 | 93% | 1110e | 0.85 ± 0.10 |
Binding in membranes prepared from CHO or HEK293 (A2A only) cells stably expressing one of three hAR subtypes, unless noted. The binding affinity for hA1, A2A and A3ARs was expressed as Ki values (n = 3–4, unless noted), measured using agonist radioligands [3H]N6-R-phenylisopropyladenosine 35, [3H]2-[p-(2-carboxyethyl)phenyl-ethylamino]-5′-N-ethylcarboxamido-adenosine 36, or [125I]N6-(4-amino-3-iodobenzyl)adenosine-5′-N-methyl-uronamide 37, respectively. Additional values designated (m) are for mouse ARs. A percent in italics refers to inhibition of binding at 10 μM. Nonspecific binding was determined using 38 (10 μM). Values are expressed as the mean ± SEM. Ki values were calculated as reported.24
Percent of inhibition at 10 μM.
1, MRS5698; 2, MRS5980; 4, MRS5979; 5, MRS7110; 15, MRS7126; 17, MRS7138.
n = 1.
ND – not determined.