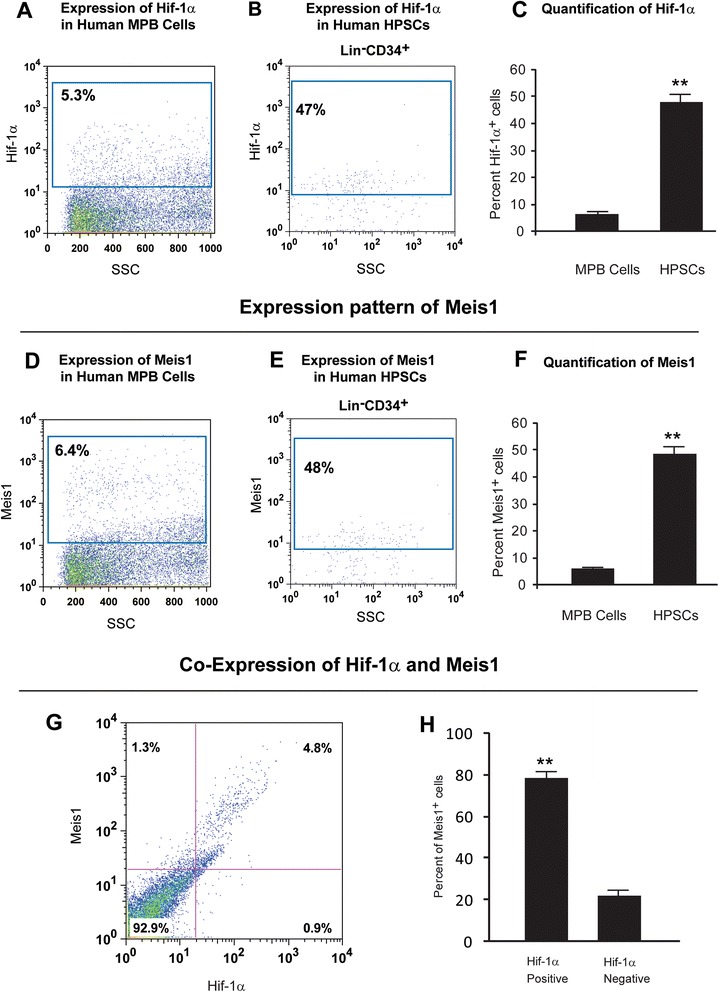
Fig. 4.

Expression profile of Hif-1α and Meis1 in human HPSCs. Expression pattern of Hif-1α a) The left panel shows expression of Hif-1α in human MPB cells. b) Expression of Hif-1α in human HPSCs. c) Quantification of Hif-1α expression. Note that while 5.3 % of the human MPB cells express Hif-1α, the significantly higher percentage (47 %) of HPSCs express Hif-1α (~9 fold) (n = 3). Expression pattern of Meis1 d) The left panel shows expression of Meis1 in human MPB cells. e) Expression of Meis1 in HPSCs. f) The right panel shows quantification of Meis1 expression. Note that while 6.4 % of the human mobilized peripheral blood cells express Meis1, 48 % of HPSCs express Meis1 (n = 3) (~7.5 fold). Co-expression of Hif-1α and Meis1 g) Flow cytometric colocalization of Hif-1α and Meis1 in the human MPB cells. Left panel shows a representative flow cytometry profile of Hif-1α and Meis1 expression. h) Quantification of the percent of Meis1+ cells. Note the majority of Meis1+ cells coexpress Hif-1α. **p < 0.01
