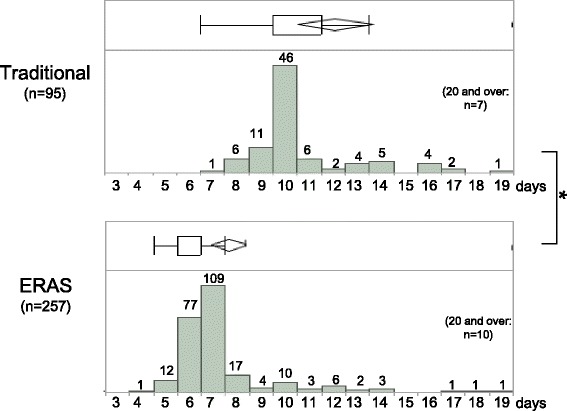
Fig. 1.

Postoperative length of hospital stay (LOS) is shown as a histogram and box and whisker plots (25th, 75th percentiles) for both traditional and ERAS groups. Median LOS is indicated by horizontal bars, and mean LOS by rhombuses. Horizontal boundaries of the boxes represent the first and third quartiles. *P < 0.05
