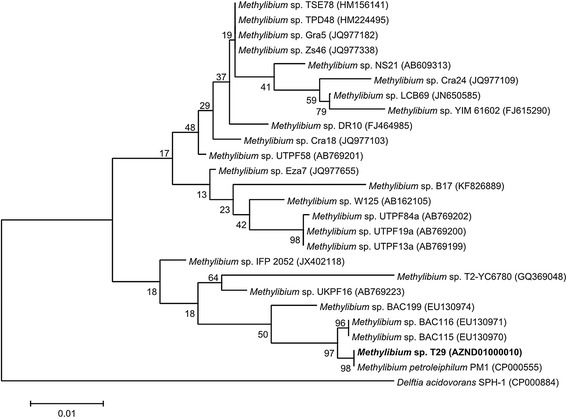
Fig. 2.

Dendrogram indicating the phylogenetic relationships of Methylibium sp. T29 relative to other Methylibium isolates. The maximum likelihood tree was inferred from 1329 aligned positions of the 16S rRNA gene sequences and derived based on the Tamura-Nei model using MEGA 6 [15]. Delftia acidovorans SPH-1 was used as an outlier. Bootstrap values (expressed as percentages of 1000 replicates) are shown at branch points. Bar: 0.01 substitutions per nucleotide position. The corresponding GenBank accession numbers are displayed in parentheses
