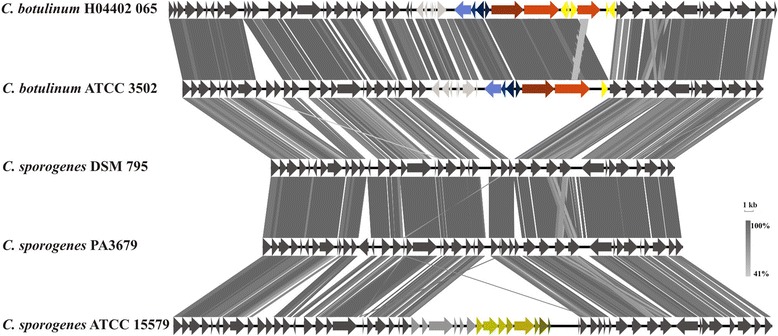
Figure 7.

Tblastx comparison of the botulinum neurotoxin cluster (BoNT/A) and the flanking regions between C. botulinum and C. sporogenes strains. For the tblastx comparison an E-value cutoff of 1e-10 was set. Visualization was done with Easyfig. The neurotoxin cluster was marked in red tones, haemagglutinin components of the neurotoxin complex in blue tones, transposases in bright yellow, genes identified only in the C. botulinum strains in light grey, the CRISPR/cas system of C. sporogenes ATCC 15579 in olive tones, and singletons identified for the latter strain in grey. Core genes are anthracite-colored.
