
Figure 2. Prevalence of Amyloid Positivity on PET According to Age for the Different Dementia Diagnostic Groups.
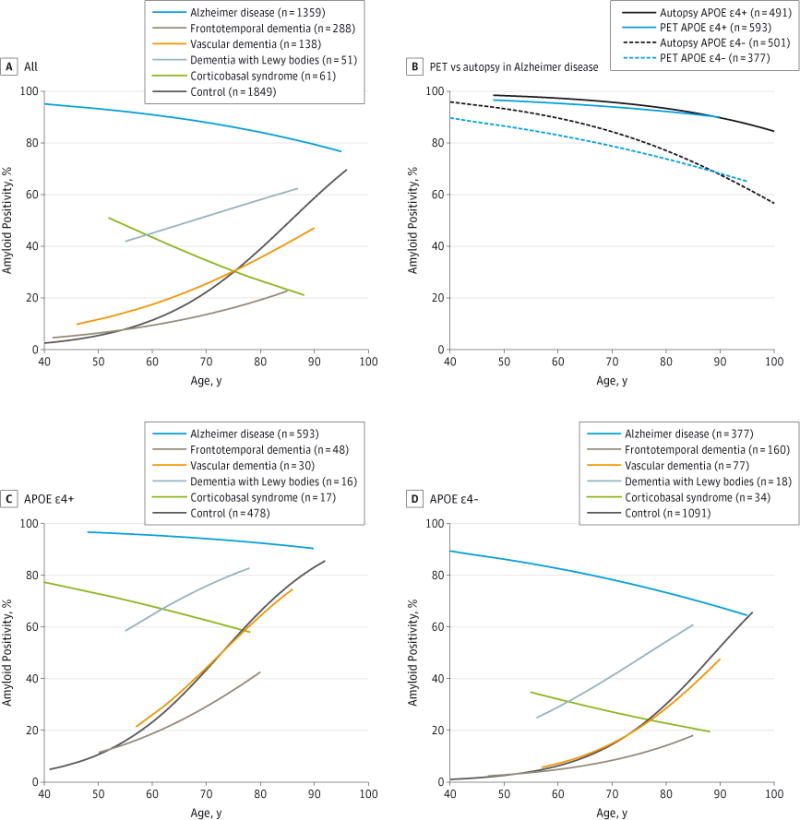
PET indicates positron emission tomography. The curves were plotted using the point estimates generated by generalized estimating equations and are within the age limits of the diagnostic groups. The models were adjusted for study effects. The 95% CIs are presented in Table 2 and eFigure 3 in the Supplement.