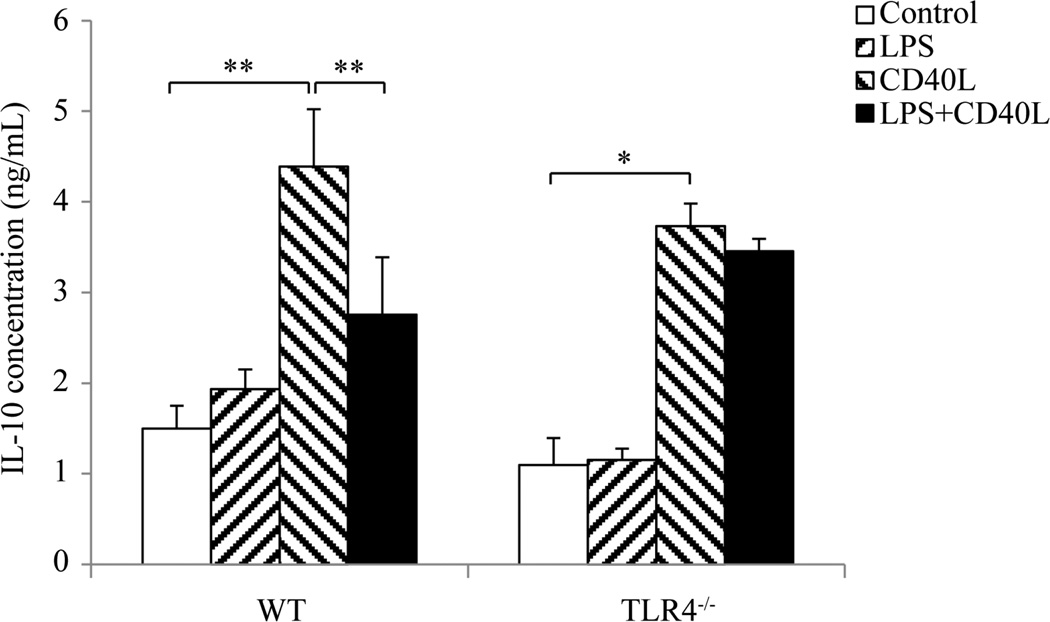
Figure 4.
IL-10 protein production by B10 cells after LPS and/or CD40L stimulation. Cultured mouse slpenocytes were treated with E. coli LPS (10 µg/ml) and/or CD40L (1 µg/ml) for 2 days and CD19+CD1dhiCD5+ cells in the cultured splenocytes were sorted out using flow cytometry. Total protein lysate were collected from sorted cells and IL-10 production was determined by ELISA. At least 100,000 cells were sorted from each sample for ELISA. Data are presented as mean ± SEM, n = 6. Student t-test, *P < 0.05, **P < 0.01.

