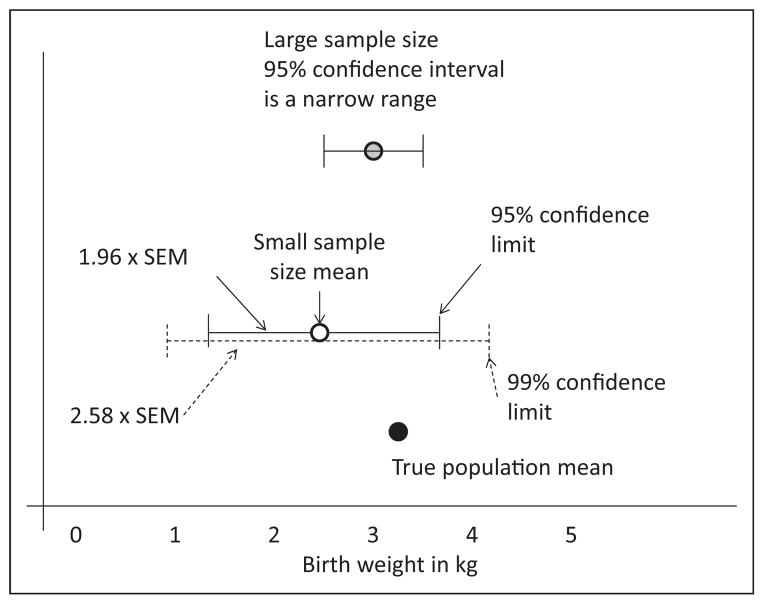
Figure 7.
Confidence interval. The true population mean (birthweight in this example) is shown by the black circle. The white circle represents the mean of a small sample (eg, your hospital deliveries). The 95% confidence interval is shown by the solid line (and is mean ± 1.96 × SEM). Increasing confidence from 95% to 99% will widen the range of the confidence interval to mean ± 2.58 × SEM). Increasing the sample size (eg, including all births in a county or state) will narrow the confidence interval.

