
Figure 9.
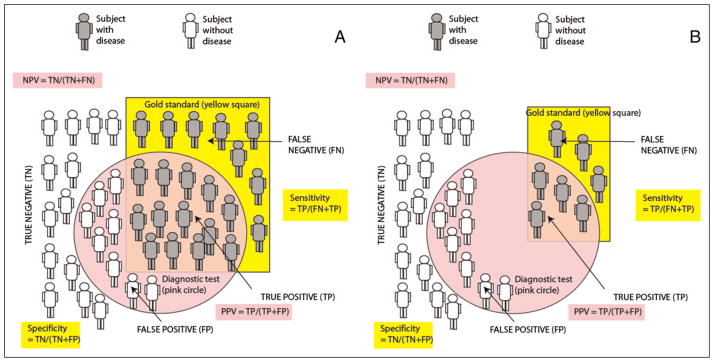
A. Sensitivity, specificity, and positive predictive value (PPV) and negative predictive value (NPV), the gold standard for diagnosis, identifies patients with disease (shown as gray subjects) located in the yellow square. Subjects without disease are shown in white color. The diagnostic test is positive in subjects located inside the pink circle. B. The impact of reduced disease prevalence on PPV and NPV. The number of subjects with the disease (based on the gold standard test) decreases secondary to reduced prevalence. Because of a reduction in the number of true positive (TP) subjects, PPV decreases. NPV increases because of a decrease in false-negative (FN) subjects. Sensitivity and specificity are not influenced by disease prevalence. The effect of increased prevalence is opposite of the change in predictive values associated with reduced disease prevalence and is shown in Table 7 (increased PPV and decreased NPV).