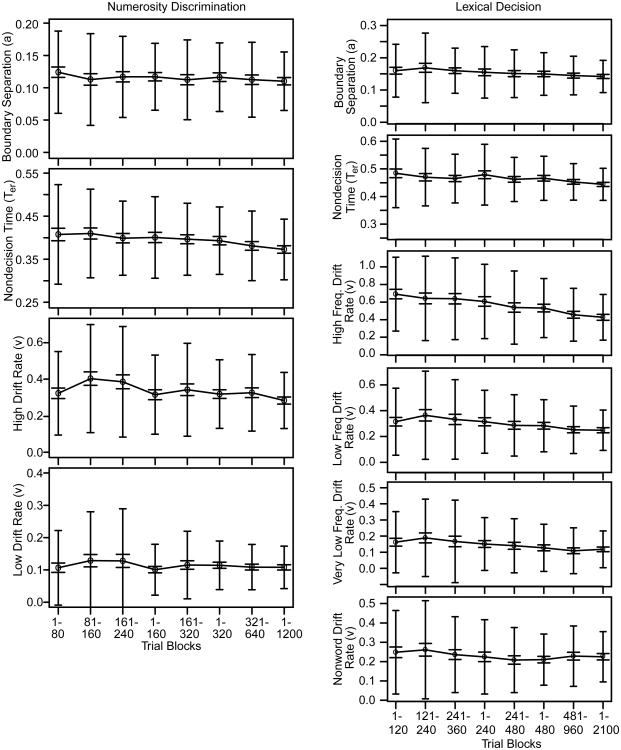
Figure 2.
Plots of the mean values of model parameters across subjects along with the SD's and SE's across subjects for several divisions of the data from Experiments 1 and 2 (the numerosity discrimination and lexical decision tasks respectively). The larger error bars are 2 SD confidence intervals in model parameters and the smaller error bars are 2 SE confidence intervals.

