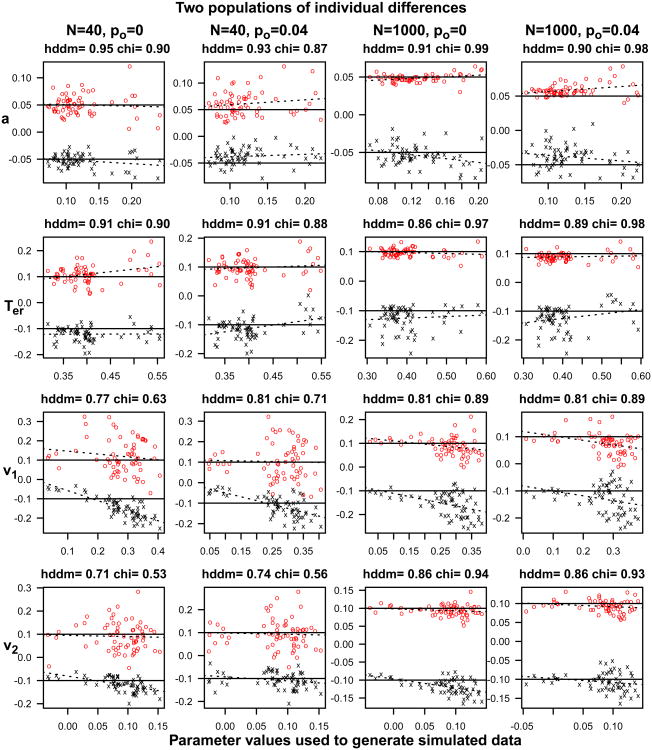
Figure 6.
Plots of the recovered values of parameters from the hierarchical fitting method and for the chi-square method for the numerosity design with parameters drawn from two distributions for 40 and 100 observations per condition and for 0 and 4% contaminants. Plotted on the y-axis are the recovered parameter values minus the values used to generate the simulated data (i.e., the residuals) offset by the amount represented by the thick horizontal lines. The circles are for the chi-square method and the crosses are for the hierarchical method. The dashed lines are regression lines for the two methods (shrinkage of model parameters results in a negative slope). The numbers at the top of each plot are the correlations between the recovered values and those used to generate the simulated data for the two methods.

