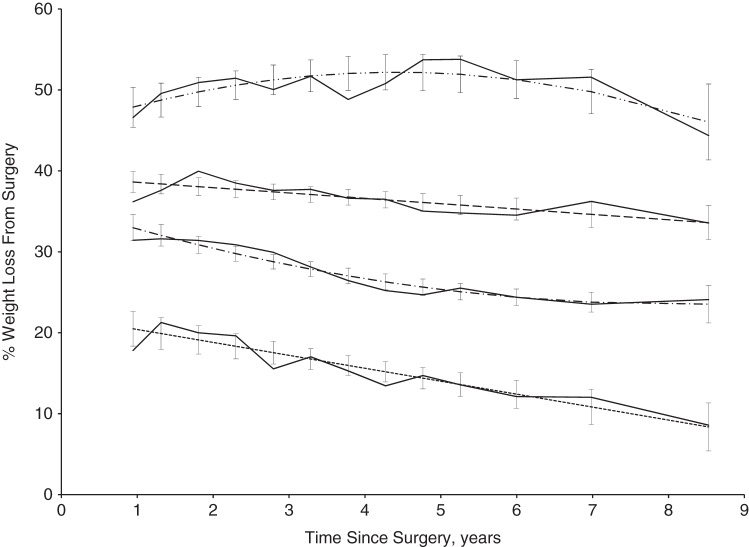
Figure 2.
Trajectory-based model and average observed percent weight loss by group among 162 bypass patients enrolled in the NUgene Project (2002–2013) from 1 to over 9.5 years of follow-up after Roux-en-Y gastric bypass surgery at Northwestern Medicine Hospital and NorthShore University HealthSystem. The dash-dot-dot-dash line represents the trajectory plot of group 4, the large dashed line represents the trajectory plot of group 3, the dot-dashed-dot line represents the trajectory plot of group 2, and the small dashed line represents the trajectory plot of group 1. For each group, confidence intervals are depicted for the trajectory plots, and the average observed percent weight loss among each group is shown as a solid line.

