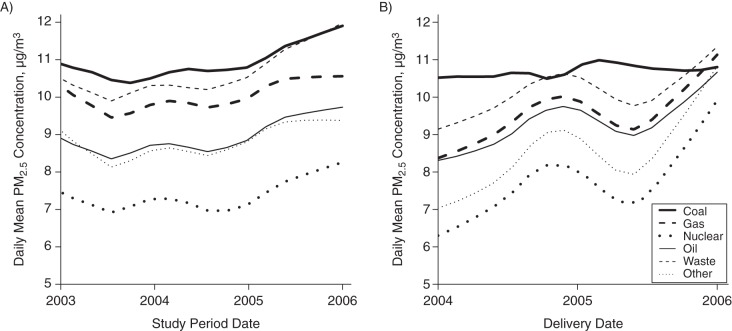
Figure 2.
Exposures to levels of particulate matter less than 2.5 µm in diameter (PM2.5) stratified by power plant type in Florida from 2003 to 2005. A) Daily concentrations of PM2.5 during the study period 2003–2005 at power plants; B) mean daily PM2.5 concentration at residential address during the first trimester for births in Florida from 2004 to 2005.

