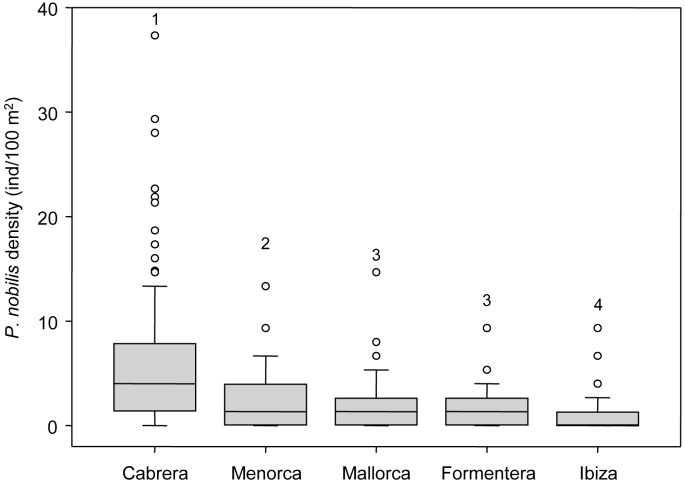
Fig 3. Mean values (±standard error) of living P. nobilis density (individuals/100m2) among islands.
Median values are included, the rectangles contain values between the first and the third quartiles, the bars represent the variability outside the upper and lower quartiles, outliers are shown as circles. SNK groups are shown by numbers.

