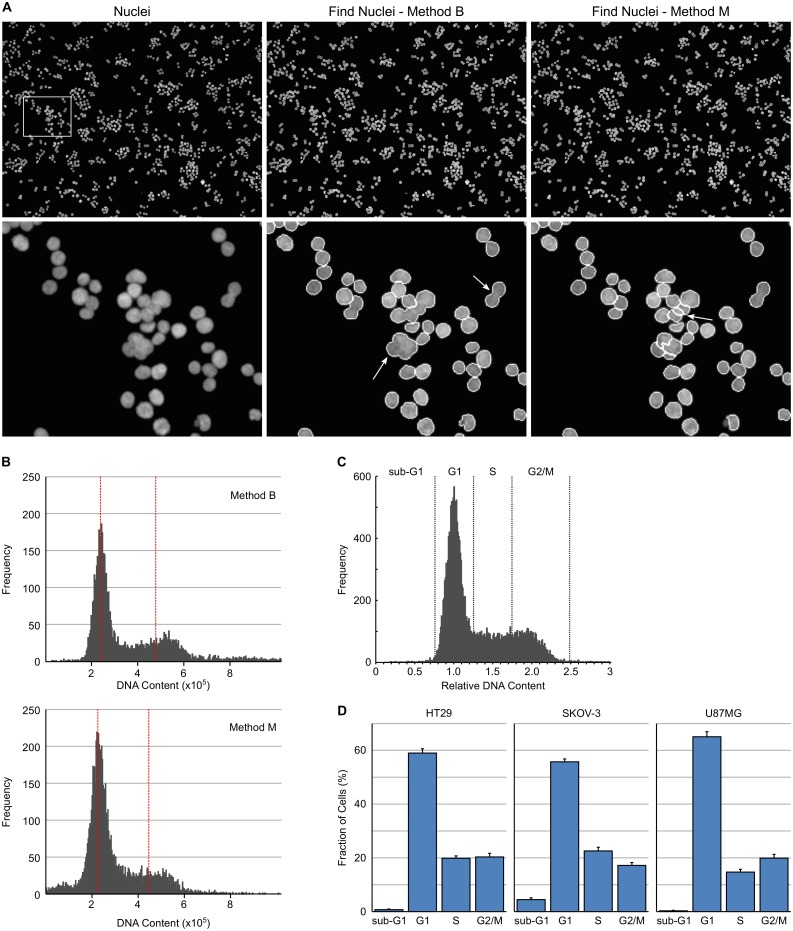
Fig 1. High-content cell cycle analysis based on DNA content.
(A) Example images of HT29 cells with nuclei stained with Hoechst 33342 and then segmented with Harmony software using Find Nuclei Method B or Method M. Arrows indicate examples of incompletely segmented nuclei. (B) DNA content histograms of Hoechst 33342 stained HT29 cells, prior to application of the PhenoLOGIC algorithm, using Find Nuclei method B and M. Red dotted lines indicate the position of the G1 and G2 peak. (C) DNA content histograms obtained from HT29 cells showing gating to identify cell cycle distribution. (D) Cell cycle distribution for asynchronous HT29, SKOV-3 and U87MG cells determined from DNA content histograms. Values are the average of 8 technical replicates ± SD.

