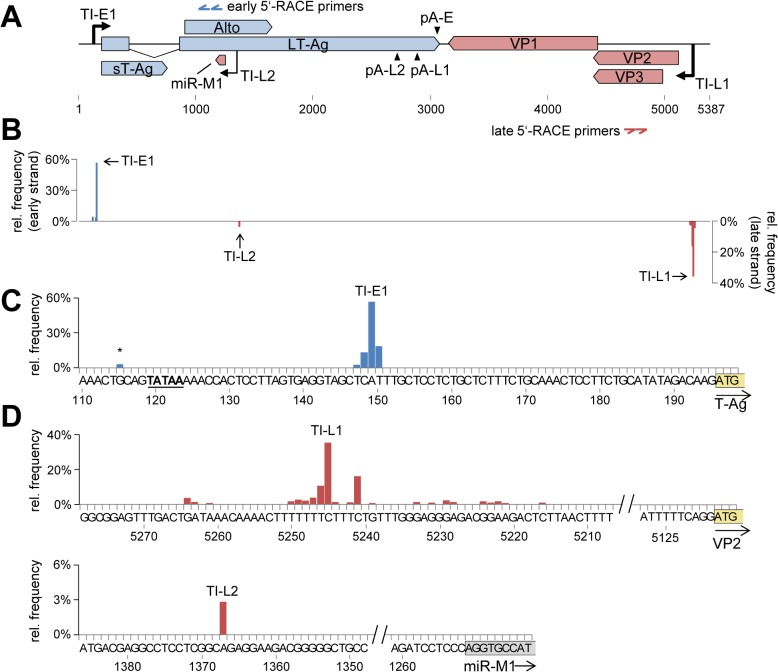
Fig 4. Mapping of early and late strand transcriptional initiation sites.
(A) Schematic depiction of the MCPyV genome. The binding sites of nested gene specific 5’-RACE primers for early and late strand are indicated by blue or red double arrows, respectively. The identified transcriptional initiation zones TI-E1 (early strand) or TI-L1 and –L2 (late strand) are shown as black arrows drawn towards the top or bottom, respectively. (B) Relative frequency of transcriptional initiation site (TIS) reads on the early (positive axis, blue) or late (negative axis, red) strands. (C) Detailed depiction of TIS coverage near the major early initiation zone TI-E1. A TATA box located upstream of TI-E1 is underlined. A minor initiation site upstream of the TATA box is marked with an asterisk. The T-Ag start codon is boxed and highlighted in yellow. (D) Depiction of TIS read coverage near the major late initiation zone TI-L1 (top panel), and a second initiation site outside of the NCCR (TI-L2, lower panel). The VP2 start codon is boxed and the first 9 nucleotides of the genomic mcv-miR-M1 locus are boxed and highlighted in yellow or grey, respectively.

