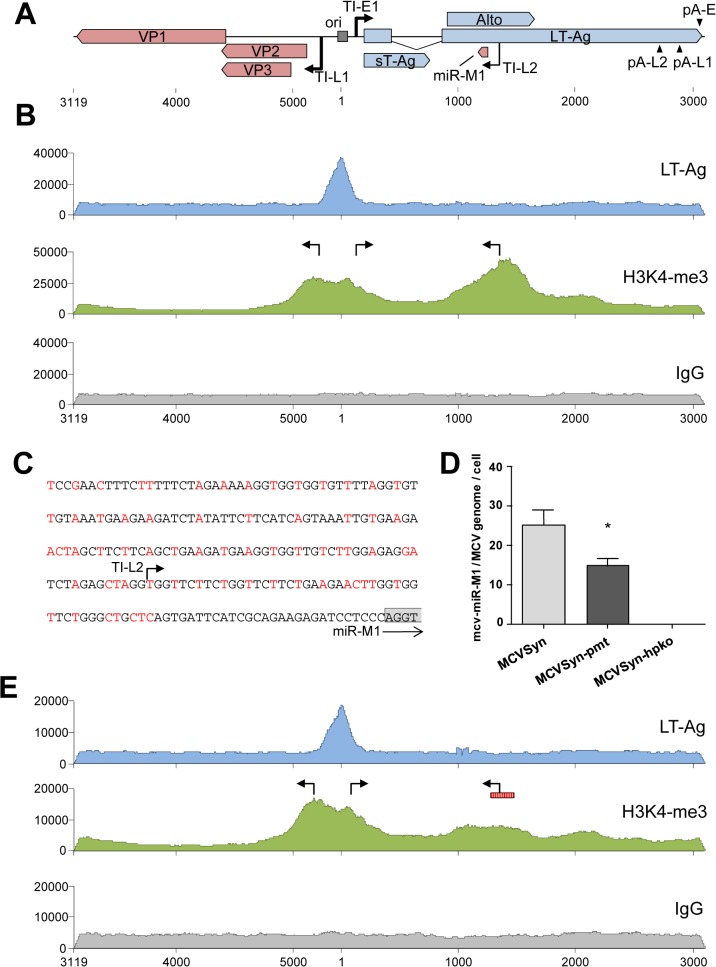
Fig 6. ChIP-seq analysis and miRNA expression in wt and mutated MCVSyn genomes.
(A) Schematic depiction of the MCPyV genome with polyadenylation and transcriptional initiation sites as identified by RACE analyses. The position of the viral core origin of replication (ori) is marked by a grey box. (B, E) ChIP-seq profiles of LT-Ag (top panel, blue), H3K4me3 (center panel, green) or the negative IgG control (bottom panel, grey) along the MCPyV genome in PFSK-1 cells after 4 days of transfection with MCVSyn (B) or MCVSyn-pmt (E). Positions of early and late transcriptional initiation sites are marked by bent arrows pointing right and left, respectively. The putative promoter region mutated in MCVSyn-pmt is symbolized by a vertically hatched box in E. Graphs depict raw ChIP-seq read coverage; note that absolute read numbers depend on the efficiency of individual immunoprecipitations and thus only the relative coverage distribution along the viral genome is meaningful. (C) Mutations in the putative promoter region upstream of the mcv-miR-M1 locus. Substituted nucleotides are shown in red. The positions of the transcriptional initiation site TI-L2 is indicated by an arrow. The first four nucleotides of the mcv-miR-M1 locus are boxed in gray. (D) Quantitative stem-loop RT-PCR evaluation of mcv-miR-M1-5p expression in PFSK-1 cells after 4 days of transfection with MCVSyn (left), MCVSyn-pmt (center), or MCVSyn-hpko (negative control, right). Expression levels were normalized to the number of MCVSyn genomes per cell as determined by qPCR from genomic DNA. Mean values and standard deviations were calculated from three independent experiments. mcv-miR-M1 expression in MCVSyn-pmt is significantly decreased in comparison to MCVSyn (unpaired t-test).

