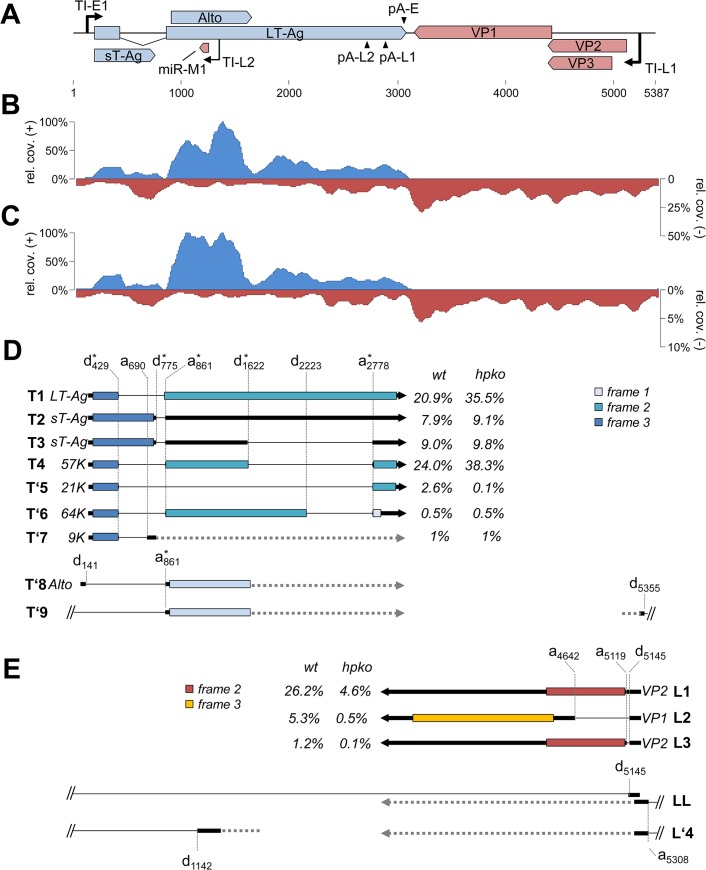
Fig 7. RNA-seq analysis of replicating MCPyV genomes.
(A) Schematic depiction of the MCPyV genome. (B, C) RNA-seq coverage of MCVSyn (B) or MCVSyn-hpko (C) genomes in PFSK-1 cells after 4 days of transfection. Read coverage on the early (positive axis; blue) or late strand (negative axis; red) is shown relative to the maximally observed nucleotide coverage (set to 100%). Note that the negative/late strand axis is shown at a lower scale in C to facilitate comparison of late strand read coverage profiles. (D, E) Structure of known or predicted early (D) or late (E) transcripts. The position of donor or acceptor sites is indicated by vertically drawn hatched lines. Previously identified donors or acceptors are marked with asterisks. Known or predicted protein products and estimated abundance values are given next to all transcripts that map to the major early or late transcription cassettes (T1-T’7 and L1-L3, respectively). We did not estimate abundance for transcripts that contain splice junctions with donors or acceptors located outside of the major transcriptional units (T’8, T’9, LL, L’4). For simplicity, regions of transcripts which are of unknown structure, or that may display splice patterns which are of no immediate consequence for coding potential are symbolized by horizontal hatched lines. Coding regions (first AUG-initiated ORF) in each of the transcripts are shown by boxes that are colored according to reading frame relative to the genomic position of major early or late transcriptional start positions (149 and 5245, respectively).

