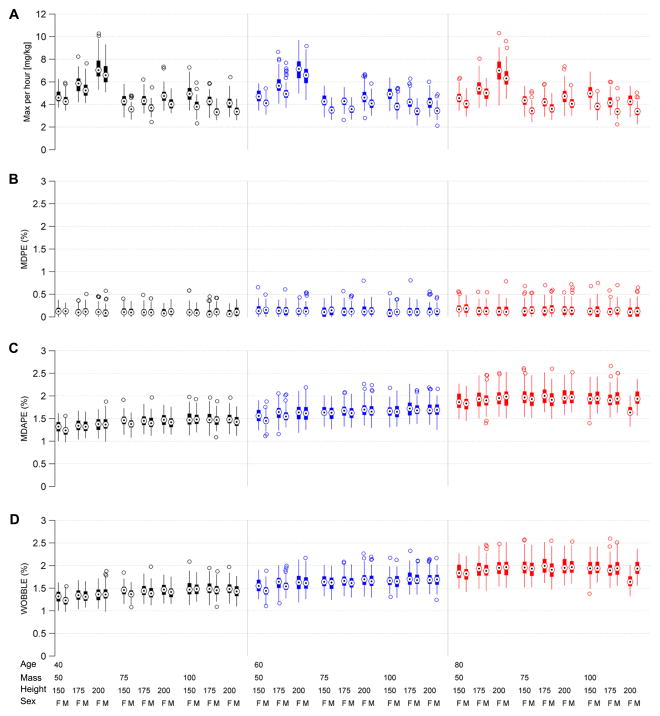
Figure 11.
Steady state performance statistics for the CLAD system, including bias (median performance error, MDPE), inaccuracy (median absolute performance error, MDAPE), and oscillation index (WOBBLE). These values are obtained by repeating the experiment illustrated in figure 8 one hundred times for each of 54 patient demographic conditions, which vary according to a factorial design by patient mass, age, sex, and height. In these box plots, circles with central dots show median values, vertical lines show the upper and lower 95% parameter bounds, and empty circles show outliers. In all cases performance is within specification.

