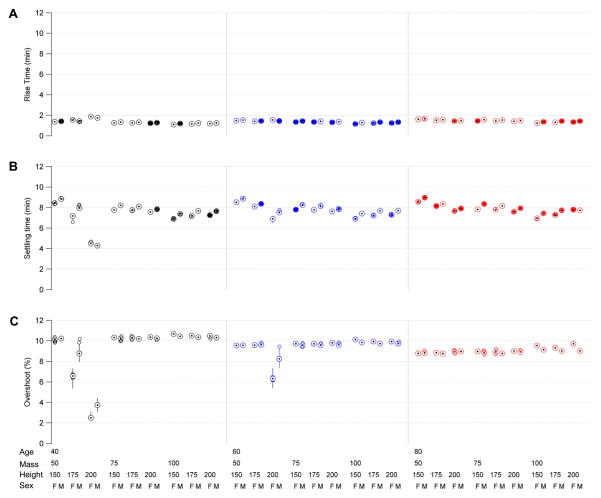
Figure 12.
Transient response performance statistics for the CLAD system, including rise time, settling time, and percent overshoot in response to a step command to bring the BSP from 0 to 80%. These values are obtained by repeating the experiment illustrated in figure 8 one hundred times for each of 54 patient demographic conditions, which vary according to a factorial design by patient mass, age, sex, and height. In these box plots, circles with central dots show median values, vertical lines show the upper and lower 95% parameter bounds, and empty circles show outliers. In all cases performance is within specification.

