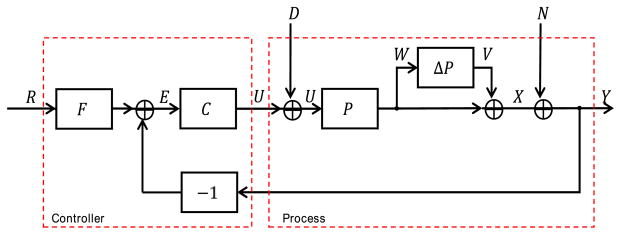
Figure 4.

Block diagram of the process model and robust controller. Symbol meanings are as follows: R, reference signal (effect site concentration corresponding to the target BSP value); E, error signal (target minus estimated effect site concentration); C, controller; U, control signal (propofol infusion rate); D, disturbance signal; Ubar, the input to the process dynamics, consisting of the control signal plus the unknown disturbance signal; ΔP, plant error term, representing the discrepancy between the nominal model and the true PK dynamics model; W, the input to the plant error term; V, output of the plant error term; X, true pharmacokinetic state of the patient, consisting of the drug concentrations in each body compartment; N, estimation error, represented here as additive observation noise; Y, observed PK state of the patient, obtained by the BSP algorithm.
