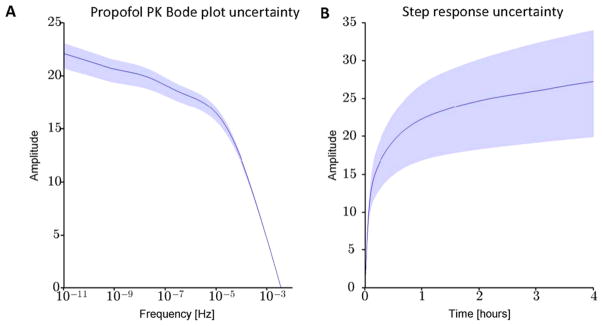
Figure 6.

Examples of Bode (A) and step response (B) plots. For this example, the simulated patient was 60 year old male with weight 75 kg and height 175 cm. Solid blue lines correspond to the nominal (population-based) model for this patients demographics, calculated from the Schnider PK equations (table 1). Shading indicates the maximum and minimum values obtained from 1000 simulations in which PK values were generated by the random sampling process described in the main text.
