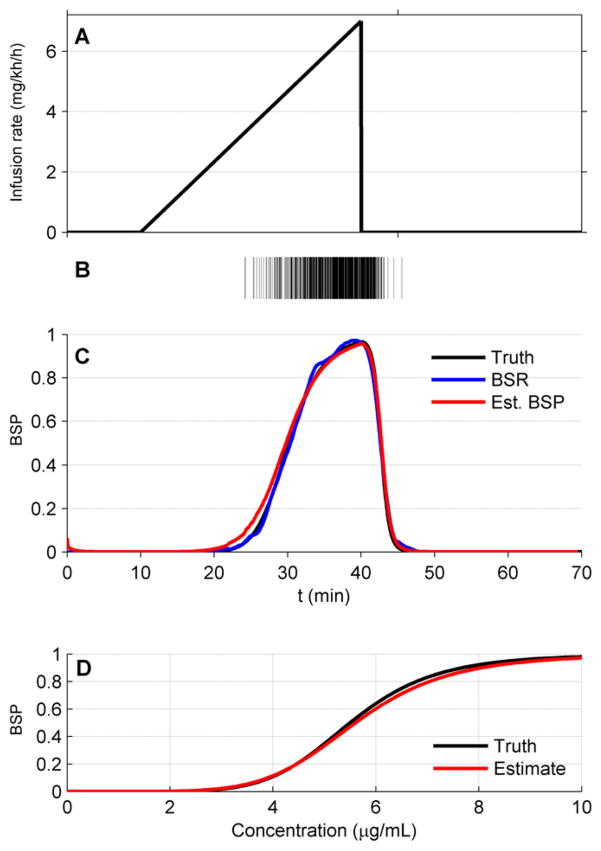
Figure 7.
Illustration of the ramp-drop experiment performed before commencement of control, used to estimate the pharmacodynamics parameters γ and C of the Hill equation. The propofol infusion rate is linearly increased over a period of 20 min (A), and the resulting EEG signal is automatically segmented to yield a binary observation sequence (B). The binary data and infusion history are used to estimate parameter values for γ̂ and Ĉ such that the BSR (blue), estimated without reference to the Hill equation, provides a close match to the BSP tracing (red) estimated by the BSP algorithm, which does depend on the Hill equation parameter values. Both curves agree well with the true BSP value (black). (C) Example of the match between the true PD curve (Hill equation) based on the values γ and C (black), and the PD curve based on the estimated values γ̂ and Ĉ (red).

