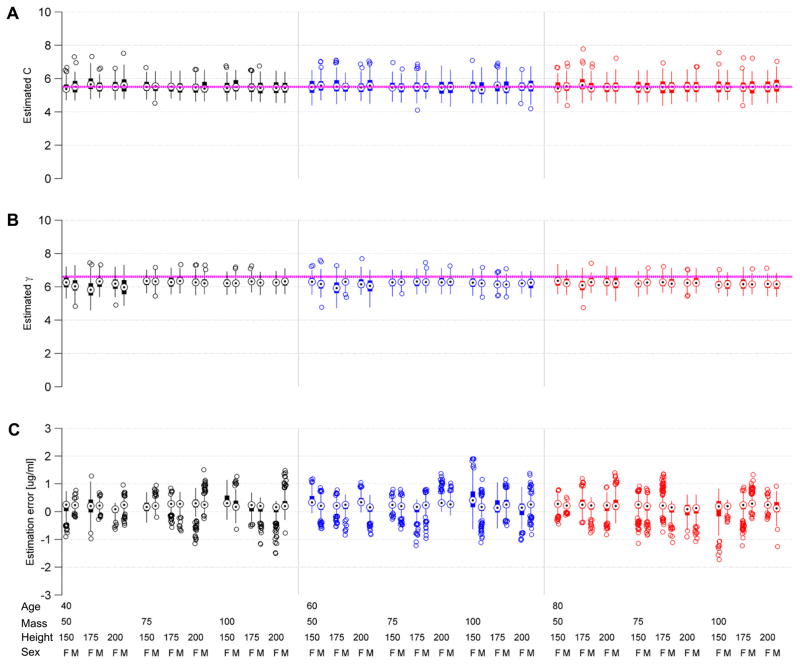
Figure 8.
Box plots for factorial estimation experiments. Each experiment consists of 100 repetitions for each of 54 combinations of patient age (40, 60, 80 years), mass (50, 75, 100 kg), height (150, 175, 200 cm) and sex (male, M; female, F). Color groupings indicate patient ages. The top panels show results of the ramp-drop experiments for estimating the pharmacodynamic parameters C (A) and γ (B). The true parameter values C = 5.5 and γ = 6.6 used to generate the observations are indicated by pink dashed horizontal lines. The bottom panel (C) shows testing results for the state estimator. The results are expressed as the true minus the estimated effect site concentration. The estimated values for C and γ from the ramp-drop experiments were used in these experiments.

