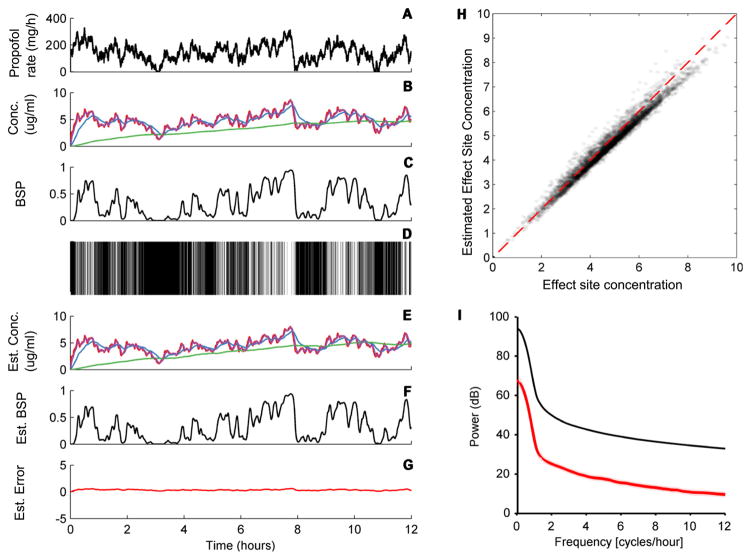
Figure 9.
Estimation error of the BSP algorithm. The panels show an example of a randomly varying infusion rate (A), the resulting four-compartment drug concentrations (state) (B), burst suppression probability (BSP) (C), the resulting binary observations (D), the estimated state (E), the estimated BSP (F), and the discrepancy between the estimated and actual BSP, which is considered observation noise (G). (H) Effect site concentration values sampled every 5 min for 100 simulations like the one shows are plotted against the estimated values, demonstrating that the estimates are consistently accurate with minimal bias over the range of clinically relevant effect site concentrations, despite underlying uncertainty about the PK parameters and imperfect accuracy in the PD parameter estimation routine. (I) Power spectral density for the driving signal (black line) relative to the observation noise/estimation error power spectrum. The signal is well above the noise ratio at all relevant frequencies.

