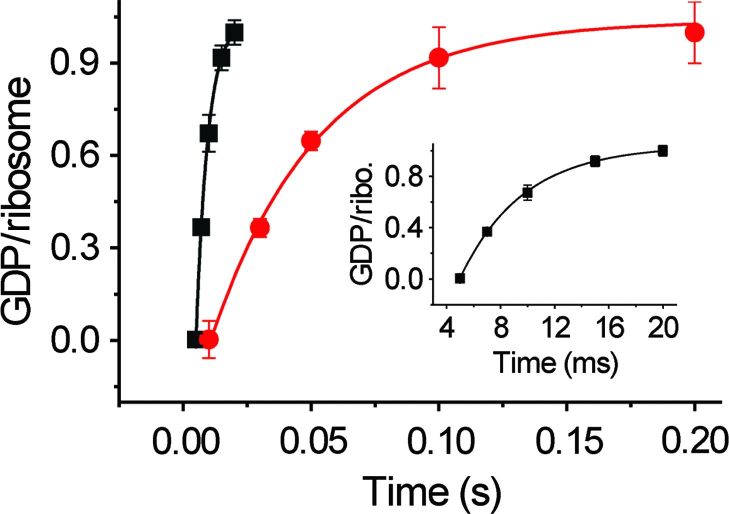
Fig. 1. Single-turnover GTP hydrolysis.
Time course of single-turnover GTP hydrolysis by wild-type (WT; black) and H91A (red) EF-G. The amount of [3H]GDP produced is plotted against time and fitted with a single exponential function. The rate constants are 202 ± 29 s−1 for WT and 28 ± 4.5 s−1 for H91A EF-G. Error bars represent SDs obtained from three independent experiments. Ribo., ribosome.

