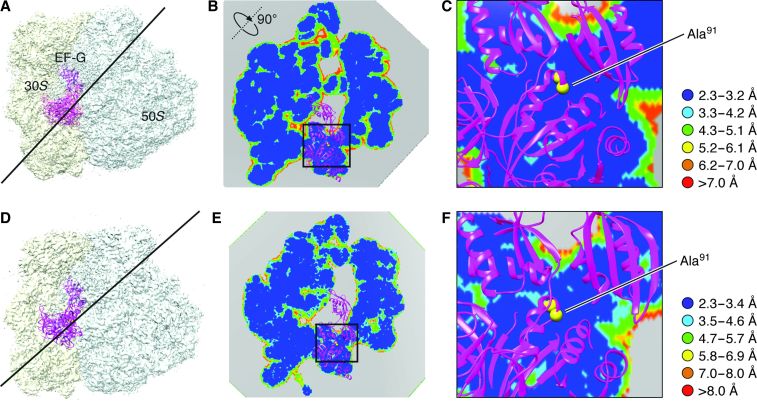
Fig. 4. Map resolution in a plane adjacent to residue Ala91.
(A) Map of the nonrotated ribosome complex. The line indicates the position of the section of the map in which the local resolution map is viewed. (B) Local resolution map in the section at the position shown in (A). (C) Zoomed-in view of the boxed region in (B). Resolution ranges are color-coded. (D to F) Illustrations of the rotated complex, corresponding to (A) to (C), respectively.

