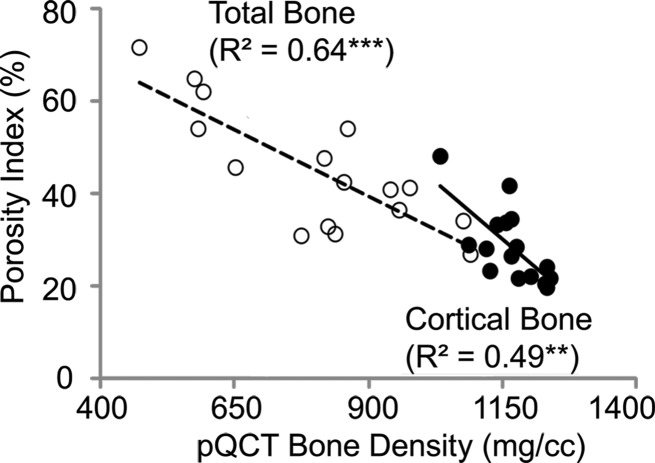
Figure 3c:
Correlations between porosity index and (a) micro-CT (μCT)–derived porosity, (b) age, and (c) peripheral quantitative CT (pQCT) scanner–derived bone mineral density obtained on the basis of cortical and total bone regions of midtibia specimens. Black dots represent data from the cortical region, white dots represent data from the total region, the solid line represents linear fitting of data from the cortical bone region, and the dashed line represents linear fitting of data from the total bone region. ** P < .005, *** P < .001.

