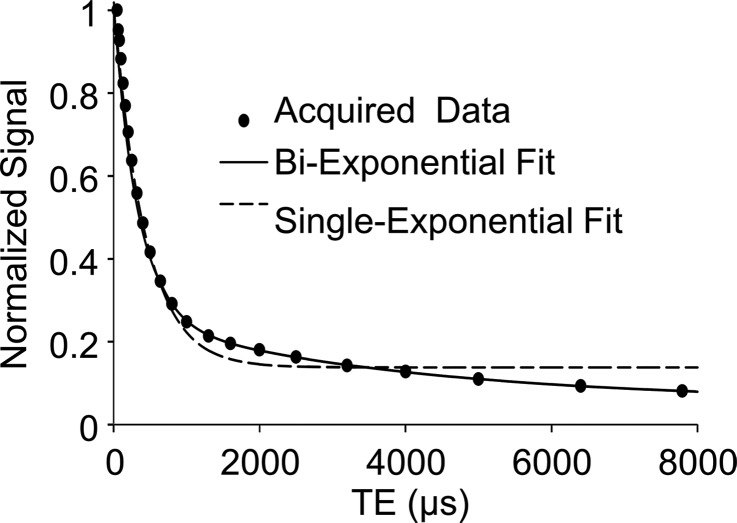
Figure 5c:
Graphs show results from biexponential analysis in tibia specimens. Association of porosity index with (a) pore water fraction and (b) pore water T2* derived from biexponential analysis of multiecho UTE decay. In a and b, black dots represent data from the cortical region, white dots represent data from the total region, the solid line represents linear fitting of data from the cortical bone region, and the dashed line represents linear fitting of data from the total bone region. (c) A representative UTE signal decay that shows better agreement with biexponential fitting (R2 > 0.99) compared with single-exponential model ( R2 = 0.52) for TE greater than 1 msec. (d) Residual error for single and biexponential fitting at each TE in the cortical bone region. Vertical bars indicate the standard error of the means across all bone specimens.

