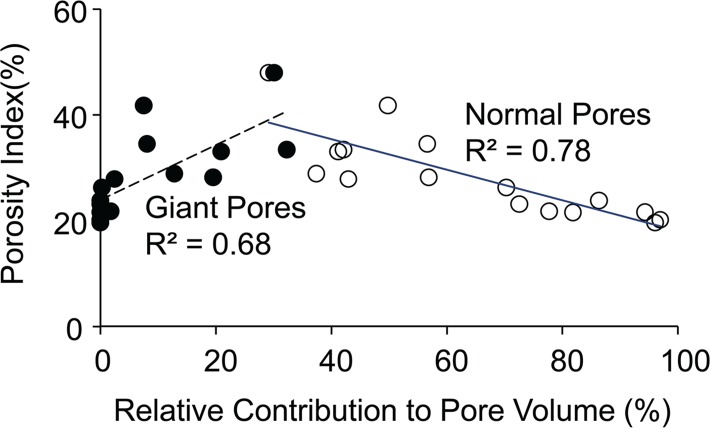
Figure 7a:
Graphs show relative contribution of giant and normal pores to the total pore volume assessed on the basis of micro-CT images of tibia specimens in the cortical bone region and their association with (a) porosity index and (b) age. Black dots represent data from the cortical region, white dots represent data from the total region, the solid line represents linear fitting of data from the cortical bone region, and the dashed line represents linear fitting of data from the total bone region. P < .001.

