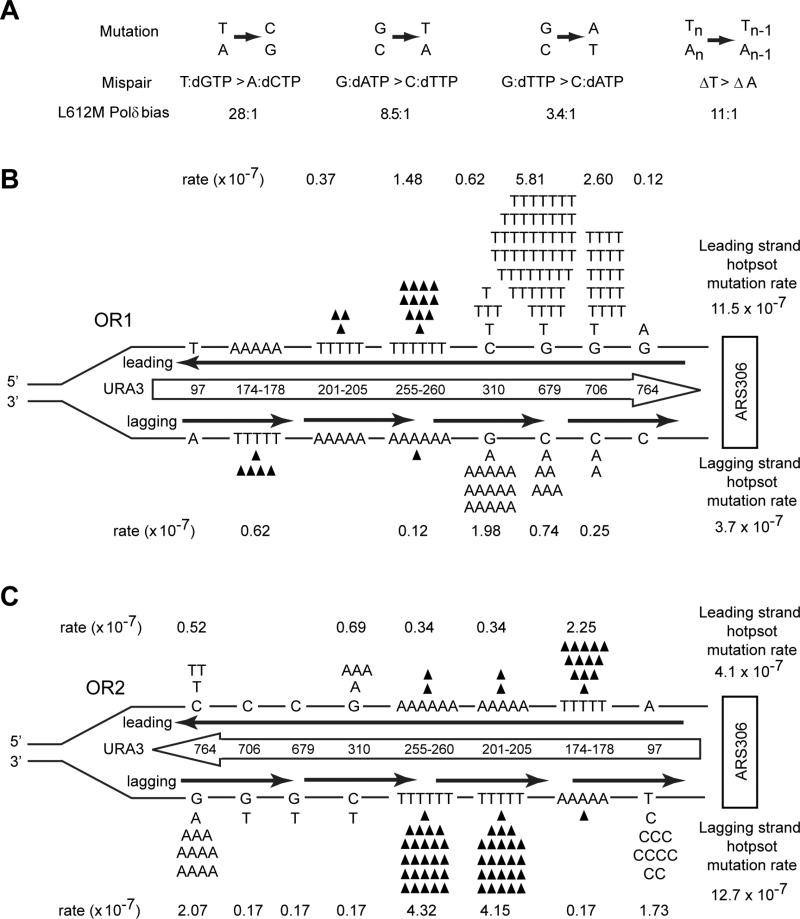
Figure 2. Lack of strand bias of URA3 mutations near ARS306 in the S288C pol3-L612M msh2Δ strain.
(A) Mispair generation bias of L612M Polδ. Point mutations are shown above the two mispairs that generate the mutation. The bias of L612M Polδ for each mispair is given below (Nick McElhinney, 2007) (B) Hot spot mutations in URA3 observed in OR1 in the S288C pol3-L612M msh2Δ strain. The orientation of the URA3 ORF (boxed arrow) is depicted by the direction of the arrow. URA3, integrated ~1.2 kb to the left of ARS306 in chromosome 3 is shown schematically and is not drawn to scale. Each hot spot is shown by their respective base pairs, and their positions in the URA3 ORF are shown within the boxed arrow. Base changes generated during the replication of the leading strand (above) and the lagging strand (below) are shown. Filled in triangles represent −1 frameshift mutations. The proportion of observed mutations at each site were assigned to the lagging and leading strand according to the bias for mispair formation by L612M Polδ shown in (A). Strand specific mutation rates for each site were calculated as described in the text, and the leading and lagging strand hot spot mutation rates given on the far right are the sum of all hot spot mutations on that strand. (C) Hot spot mutations in URA3 observed in OR2 in the pol3-L612M msh2Δ strain. The orientation of URA3 is reversed from that in (B).
See also Figures S2, S4, S5, and Tables S1 and S2.

