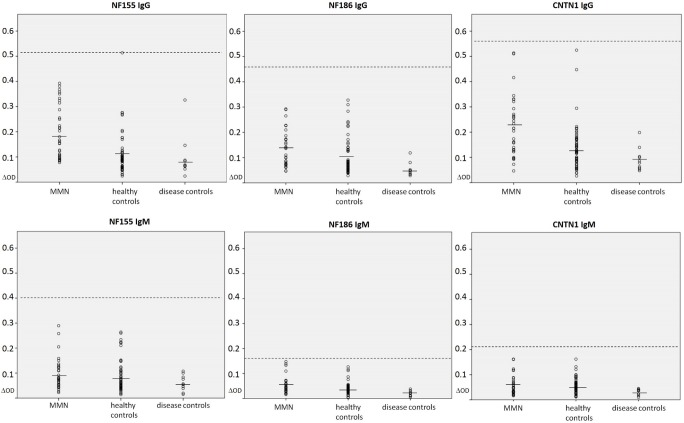
Fig 2. Dot plots showing the optical density measured by ELISA.
Samples from patients with MMN, healthy and disease controls reacting to neurofascin-155 IgG (A), neurofascin-186 IgG (B), contactin-1-IgG (C), neurofascin-155 IgM (D), neurofascin-186 IgM (E) and contactin-1 IgM (F) are shown. All patients except for one control in the neurofascin-155 IgG assay are within normal range (dashed line, five standard deviations above the mean of all controls (line)). OD = optical density, NF = neurofascin, CNTN = contactin

