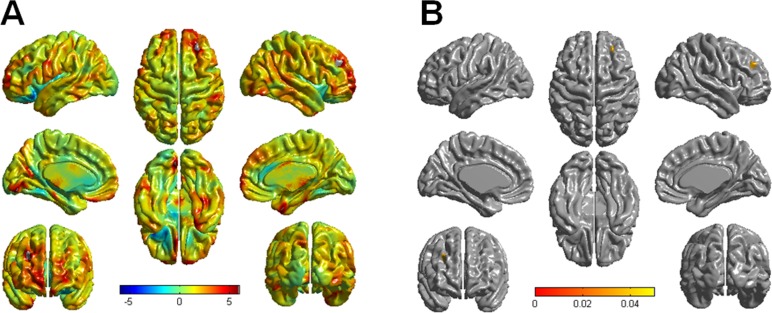
Fig 2. Comparison of cortical thickness in patients with Parkinson’s disease (PD) with controls.
(A) The red color indicates severe differences between groups in cortical thickness. The PD-punder group tended to have more severe cortical atrophy in the bilateral dorsolateral prefrontal and orbitofrontal cortices, in the right anterior temporal cortex, in the right parietal cortex, and in the left medial occipital cortex. (B) In the corrected t-statistical maps of cortical thickness, only the right dorsolateral prefrontal cortex showed a statistically lower degree of cortical thickness in the PD-punder group compared with healthy controls (RFT-corrected p < 0.05).

