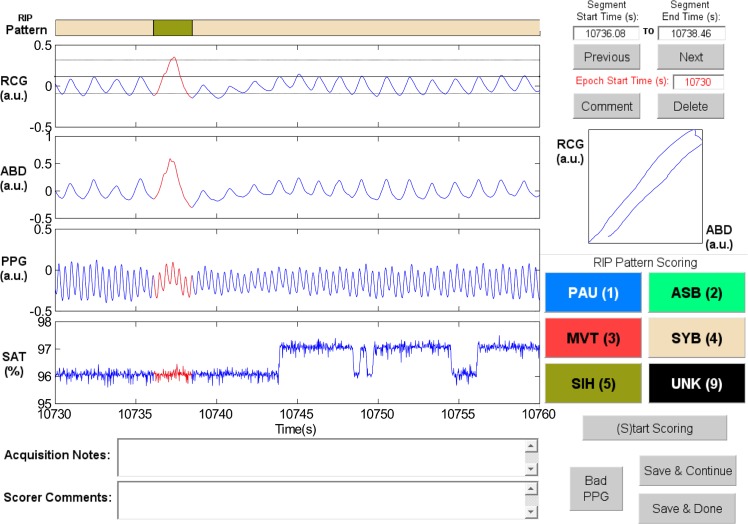
Fig 5. Representative example of Sigh (SIH).
The SIH highlighted in red has larger amplitude and longer duration than the other breaths. The horizontal dotted cursors in the ribcage (RCG) signal show an estimated variation of ± 90% of the amplitude of the breath preceding the SIH. Note that these cursors are not an exact amplitude reference. Also, the Lissajous plot shows an ellipse tilted to the right. ABD = abdomen, PPG = photoplethysmograph, SAT = blood oxygen saturation, a.u. = arbitrary units.

