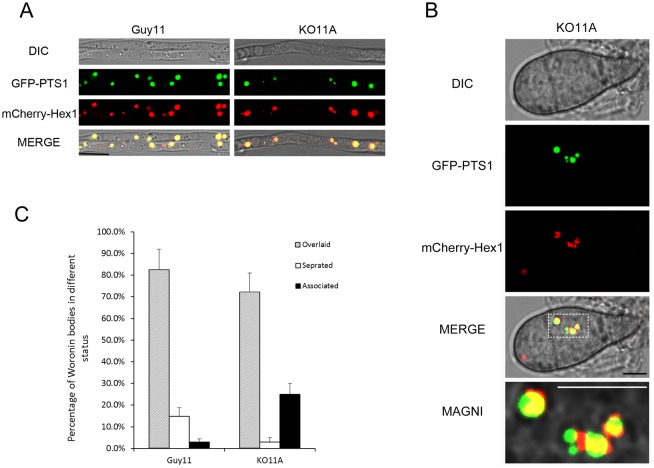
Fig 5. Analysis of Woronin bodies and peroxisomes in Guy11 and KO11A by dual fluorescence strategy.
Peroxisomes and Woronin bodies were visualized respectively with GFP-PTS1 and mCherry-Hex1 and detected by CLSM. (A) The profiles of peroxisomes and Woronin bodies in hypha cultured on complete media (CM). (B) Magnified image showing the association of the Woronin bodies to the peroxisomes in KO11A. Bars = 2 μm. (C) Statistically analysis of the Woronin bodies separated, overlaid and associated to the peroxisomes.

