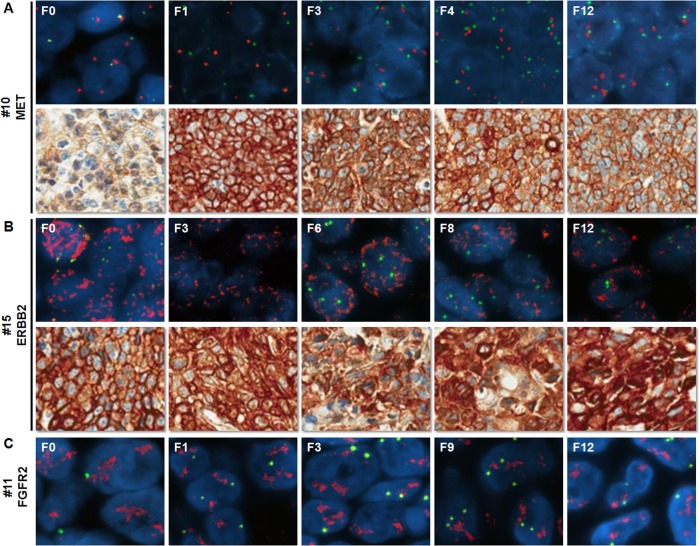
Fig 2. Biomarker profiles of serial passages of PDGCX models.
Representative images of MET status (A), ERBB2 status (B) and FGFR2 gene amplification (C) on serial passages of PDGCX models by FISH or IHC are shown. All target gene probes for FISH are labeled in red and CEP control probes are in green, nuclei are counterstained in blue by DAPI.

