
Fig 2. PCA clustering based on the antibiotic resistance gene abundance.
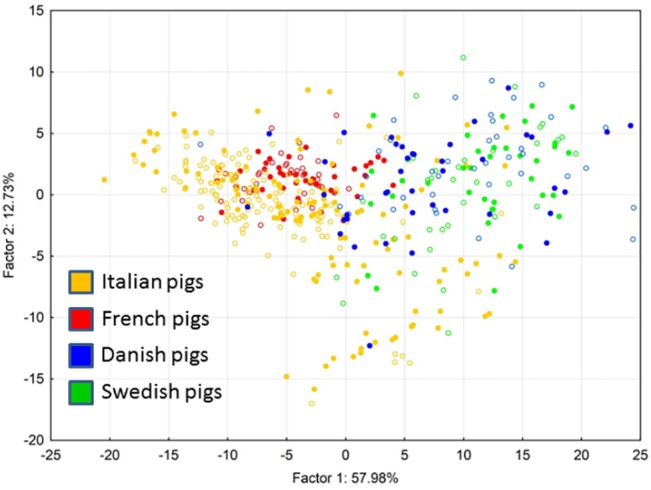
Each spot represents an individual sample tested in this study and clustered according to the abundance of 6 antibiotic resistance genes. Factor 1, accounting for nearly 58% of the variation negatively correlated with abundance of strA, sul1, sul2, tet(A) and tet(B) (correlation coefficients ranged from -0.84 to -0.76). Orange—samples from Italian farms, red—samples from French farms, blue—samples from Danish farms, green—samples from Swedish farms. Opened symbols–samples from pigs kept in conventional farms. Closed symbols–samples from pigs kept in organic farms.