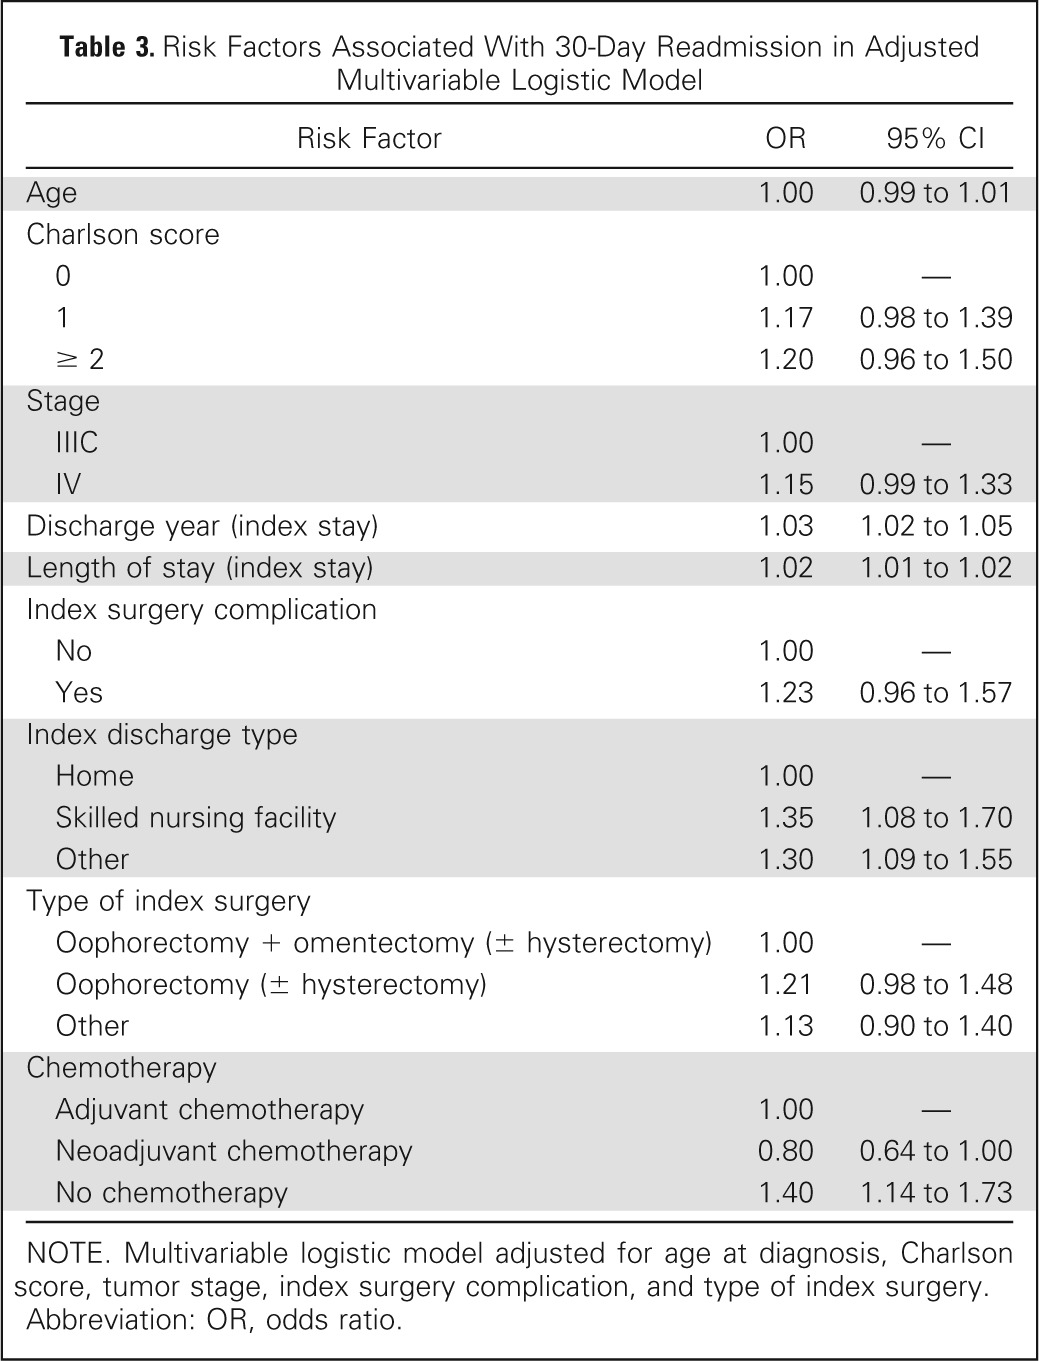
Table 3.
Risk Factors Associated With 30-Day Readmission in Adjusted Multivariable Logistic Model

| Risk Factor | OR | 95% CI |
|---|---|---|
| Age | 1.00 | 0.99 to 1.01 |
| Charlson score | ||
| 0 | 1.00 | — |
| 1 | 1.17 | 0.98 to 1.39 |
| ≥ 2 | 1.20 | 0.96 to 1.50 |
| Stage | ||
| IIIC | 1.00 | — |
| IV | 1.15 | 0.99 to 1.33 |
| Discharge year (index stay) | 1.03 | 1.02 to 1.05 |
| Length of stay (index stay) | 1.02 | 1.01 to 1.02 |
| Index surgery complication | ||
| No | 1.00 | — |
| Yes | 1.23 | 0.96 to 1.57 |
| Index discharge type | ||
| Home | 1.00 | — |
| Skilled nursing facility | 1.35 | 1.08 to 1.70 |
| Other | 1.30 | 1.09 to 1.55 |
| Type of index surgery | ||
| Oophorectomy + omentectomy (± hysterectomy) | 1.00 | — |
| Oophorectomy (± hysterectomy) | 1.21 | 0.98 to 1.48 |
| Other | 1.13 | 0.90 to 1.40 |
| Chemotherapy | ||
| Adjuvant chemotherapy | 1.00 | — |
| Neoadjuvant chemotherapy | 0.80 | 0.64 to 1.00 |
| No chemotherapy | 1.40 | 1.14 to 1.73 |
NOTE. Multivariable logistic model adjusted for age at diagnosis, Charlson score, tumor stage, index surgery complication, and type of index surgery.
Abbreviation: OR, odds ratio.
